Choose a data visualization
The power of data comes when you transform data into information. When data is processed, organized, and visualized in a meaningful and actionable way, it becomes information that drives you towards evidenced-based decisions. Many call this clinical-decision support. Data visualizations are a vital component of data analysis, as they have the capability of summarizing large amounts of data efficiently in a graphical format.
What you need is a comprehensive reporting and visualization platform that drives you towards these insights. One of the hardest parts of the analysis process is choosing the right way to represent your data using one or more of these visualizations. ESOInsights offers many chart type widgets, each with its strengths and use cases.
Information on creating or opening a dashboard is available in Add a new, blank dashboard and Find and open an existing dashboard or report, respectively. Information on adding a widget to a dashboard is available in Add a widget to a dashboard.
Real-time number charts and tables are important for context within your dashboard. It also lets you drill down into the row-level data.
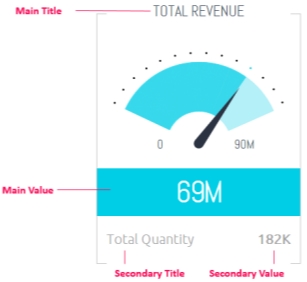
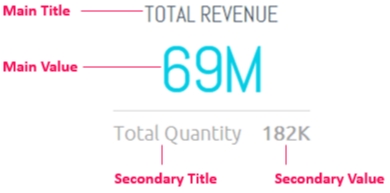
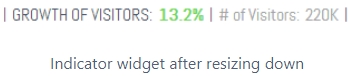
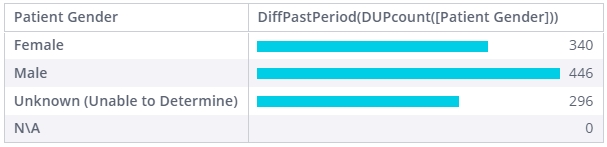
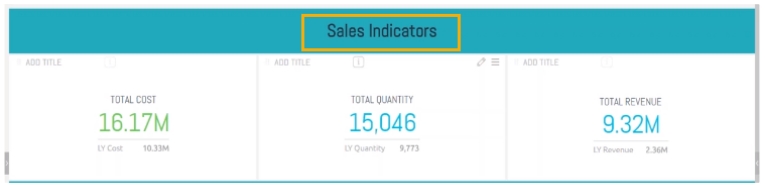
Indicator provide various options for displaying one or two numeric values as a gauge, number, or ticker. When you significantly shorten the height of an indicator, it automatically turns into a ticker type display. Indicators also provide the option to add additional titles and a color-coded indicator icon representing the value, such as a green up arrow or a red down arrow.
| Gauge indicator | Number indicator | Ticker indicator |
|---|---|---|
|
|
|
Information on configuring an indicator widget is available in Configure a 123 Indicator. Information on resizing a widget is available in Arrange and resize widgets on a dashboard.
Pivot tables let you quickly summarize and analyze large amounts of data. They are one of the most useful widgets for visualizing data. When you add more than one field to the Rows section, ESO Insights breaks the rows into sub-rows (groups).
| One field, one row | Two fields, two rows |
|---|---|
|
|
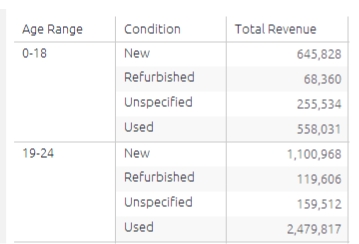
You can add grand totals and subtotals to your pivot tables, and define how to calculate these totals. You can also add data bars to your pivot tables.
| Pivot table with grand totals | Pivot table with subtotal | Pivot table with data bars |
|---|---|---|

|

|
|
Information on configuring a pivot table is available in Configure a pivot table.
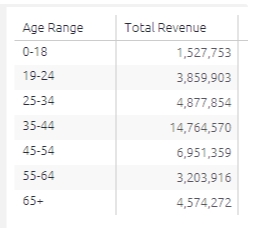
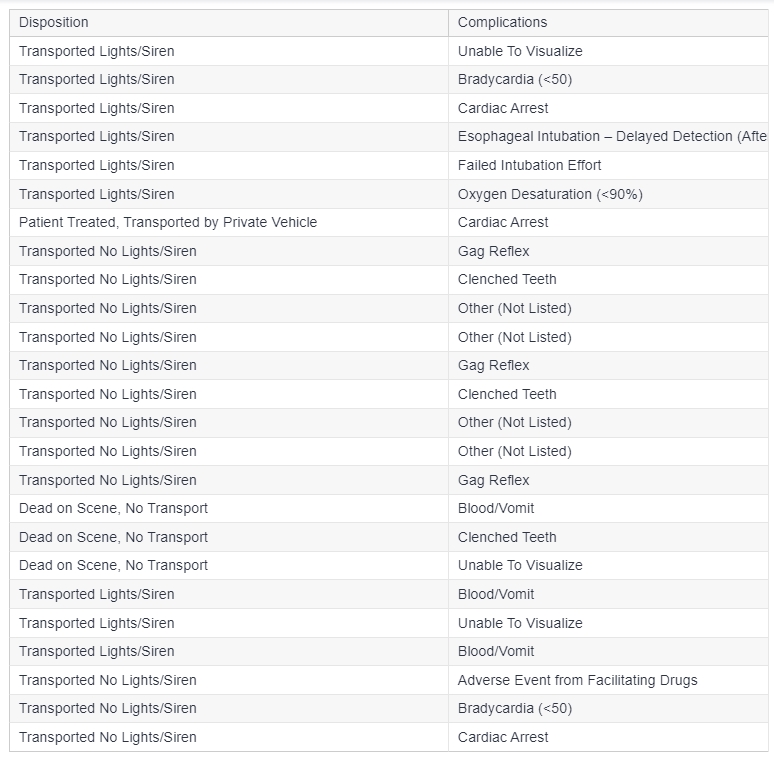
Tables display a broader view of your data, presenting raw and non-aggregated data in columns, with as many fields and metrics as needed.
Information on configuring a table is available in Configure a table.
Text is available if you want create titles and texts that stand out, or when you want to add more descriptive explanations to your dashboard and surrounding visualizations.
Information on adding text to a dashboard is available in Add a text block to a dashboard.
What to avoid
Number charts are often the first thing people see and are the quickest to read, so if there are too many on your dashboard, your narrative can get diluted. Using too many number charts many also make your dashboard a little superficial. If you want more in-depth information, limit the number of number charts and leave room for other types of data visualization that drill down a little deeper.
One of the most common and important applications for visualizing data is to see the change in value for a variable across time.
Bar charts let you display categories or items (descriptive data) along the Y-axis, with their values displayed on the X-axis. You can also break up the values by other categories or groups, and represent the data as a column chart.
Information on bar and column charts is available in Configure a column or bar chart.
Line charts let you show trends, accelerations (or decelerations), and volatility. A line chart can be used for various business cases, including:
-
Comparing data over time.
Example: Analyzing call volume for the past year.
-
Comparing changes over the same period of time for more than one group or category.
Example: Analyzing the call volume of different EMS units for the past year.
Information on configuring line charts is available in Configure a line or area chart.
Area charts also let you show trends, except that the areas under each line are filled in (colored), and it is possible to display them as stacked. This type of chart is recommended for displaying absolute or relative (stacked) values over a time period.
| Classic area chart | Stacked area chart | Stacked 100% area chart |
|---|---|---|

|
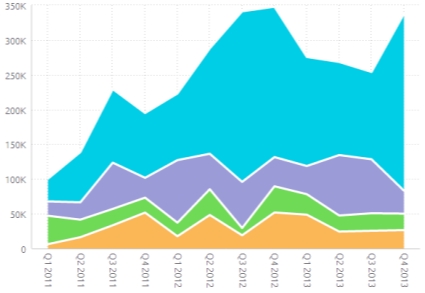
|

|
Information on configuring line charts is available in Configure a line or area chart.
Secondary-axis charts are useful when the numbers in a chart vary widely from data series to data series, or when you have mixed types of data. These charts let you plot one or more data series on a secondary vertical (value) axis.
Note: Secondary axes are available in line, area, column, and bar charts.
Information on configuring these types of charts is available in Configure a column or bar chart and Configure a line or area chart.
Calendar heat maps help visualize values over days in a calendar-like view, making it easy to identify daily patterns or anomalies.
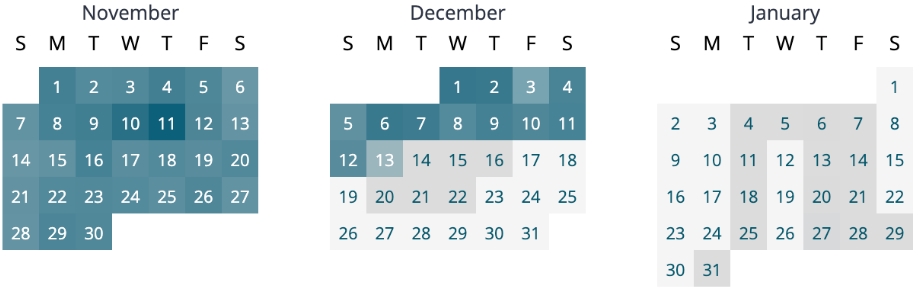
Information on configuring heat maps is available in Configure a calendar heat map.
What to avoid
-
Too many lines or bars (variables) can make your chart complicated and hard to decipher. You may also find your audience constantly referencing the legend to remind them which one they are looking at. If you have too many variables, it is time to consider a second (or even third) chart to tell this story.
-
When it comes to layout, keep your numbers relevant. When you set up your axis scale, keep it close to the highest data point.
If your primary aim is to showcase the composition of your data ( show how individual segments of data make up the whole of something), choosing the right types of data visualizations is crucial in preventing your message from becoming lost or diluted.
Pie charts display proportional data and/or percentages. Similar to pie charts, donut charts represents the whole with a circle, divided by slices into parts.
| Pie chart | Donut chart | Ring chart |
|---|---|---|
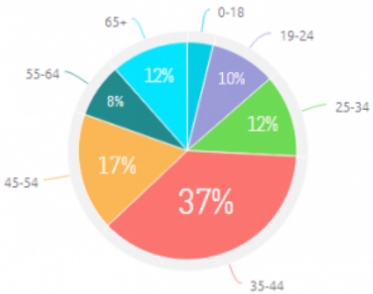
|
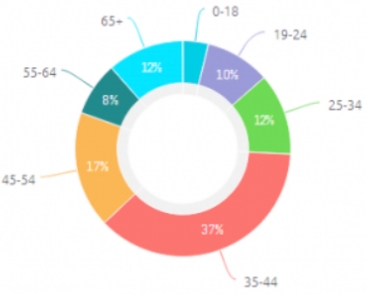
|
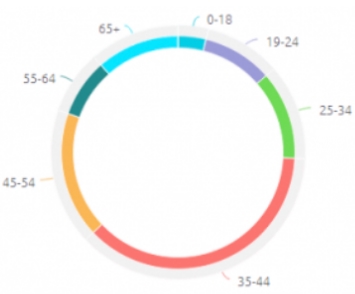
|
You can drill down into pie charts, just like in other charts. In addition, when your pie chart has so many smaller slices that they are aggregated into a single slice called Others.

If you can this slice, a second pie chart appears, containing a breakdown of all the slices included in the Others slice.
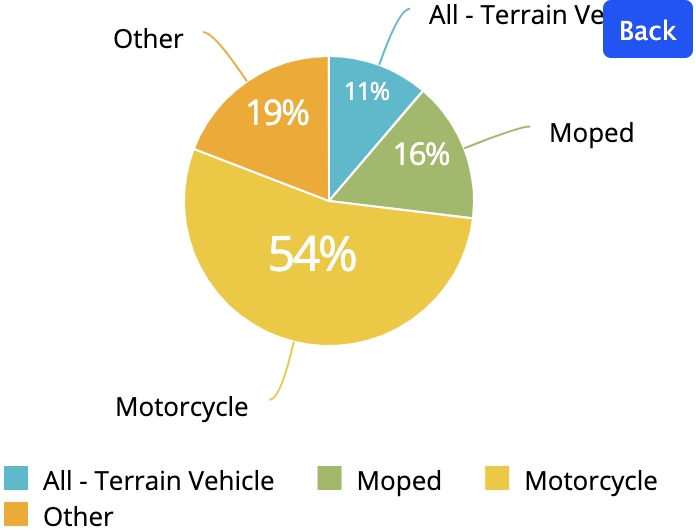
Information on configuring pie charts is available in Configure a pie chart.
Polar charts, also commonly known as a spider or radar charts, compare multiple categories/variables with a spacial perspective in a radial chart.

Information on configuring polar charts is available in Configure a polar chart.
Treemaps provide a multi-dimensional visual that displays hierarchical data in the form of nested rectangles. This type of chart can be used in different scenarios where other chart types are not effective.
Example: You need to compare too many categories and sub-categories to effectively use a column chart.
Information on configuring treemaps is available in Configure a treemap.
Sunbursts are similar to a pie chart, but are multi-dimensional. Whereas a pie chart combines one field and one numeric value, the sunburst chart can display multiple rings, one for each field. Each ring in the sunburst shows a breakdown of its parent ring slice.
Information on configuring sunbursts is available in Configure a sunburst chart.
What to avoid
-
Data visualization guru Edward Tufte famously declared that “Pie charts are bad, and the only thing worse than one pie chart is lots of them.” Pie charts portray a stagnate time frame, so trending data is off the table with this visualization method. Make sure your audience understands the time frame portrayed and try to document or label this applied filter somewhere.
-
If you are using multiple pie charts in a dashboard, it is probably best to more effectively combine the data in one chart. We recommend checking out the stacked bar chart for these cases.
Information on bar and column charts is available in Configure a column or bar chart.
Common data exploration tasks include understanding the relationship between data features, showing how data points' values are distributed, and comparing values between distinct groups.
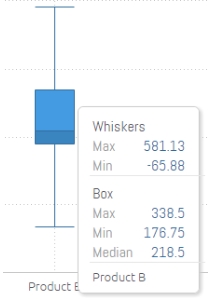
Box & whisker plots provide a convenient way of visually describing the distribution, variability, and center of a data set along an axis. Box plots are divided into four quartiles. The middle quartiles are represented by a box that contains 50% of the data and the median value. The upper and lower quartiles contain the maximum and minimum values and the remaining 50% of the data. These quartiles are represented by lines called whiskers. Box and whisker plots divide five descriptive statistics into four equal quartiles. You can view these statistics by hovering over the box plot.
The maximum and minimum values can be adjusted when defining your box and whisker plot. By default, these values are within 1.5 times of the IQR; however you can set them to the actual maximum and minimum values or to within one standard deviation of the mean of your data.
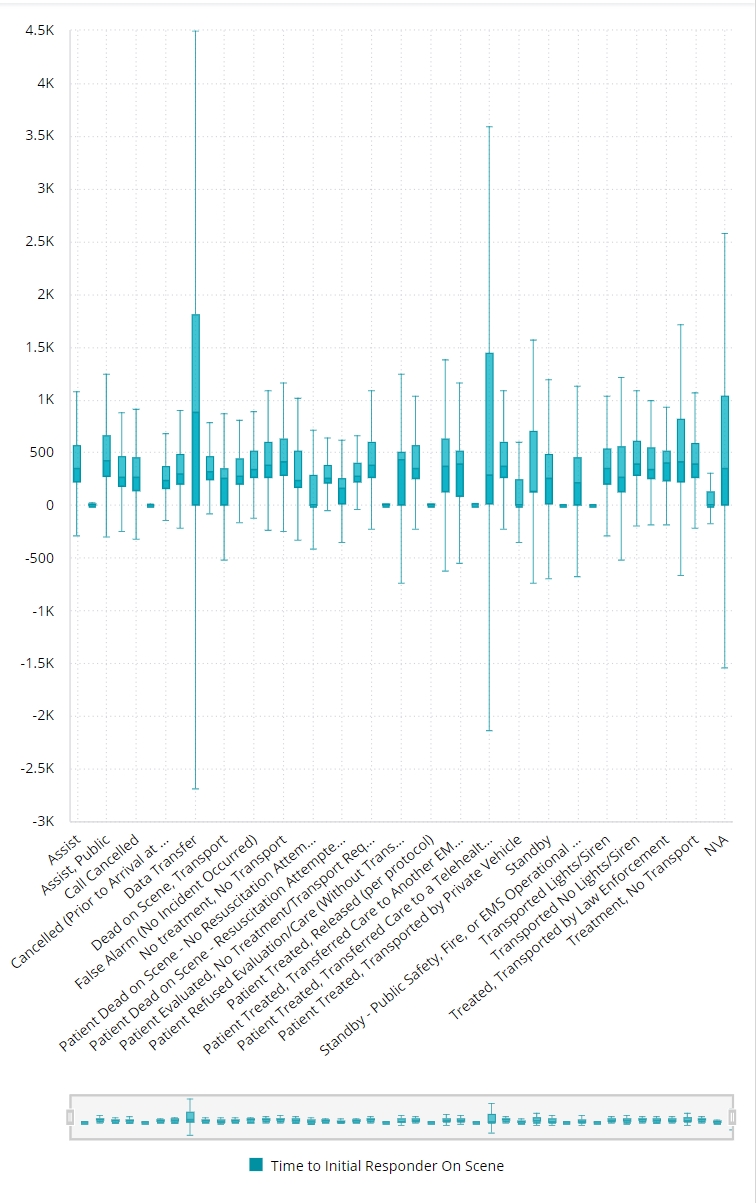
Information on box & whisker plots is available in Configure a box and whisker plot.
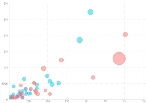
Scatter charts present the standard way of showing the relationship between two variables, and are helpful when looking for the correlation in a large data set. The scatter chart displays the distribution of two variables on an X-axis, and Y-axis, and two additional dimensions of data that are shown as colored circles scattered across the chart:
-
Point: A field where for each of its members a scatter point is drawn.
Note: The maximum amount of data points is 500.
-
Size: An optional field represented by the size of the circles. If omitted, all scatter points are equal in size. If used, the circle size is relative to their value.

Information on configuring scatter charts is available in Configure a scatter chart.
Funnel charts show shows stages in a process that are sequentially dependent. The funnel shape helps you track the health or validity of any process.
Each stage in the chart represents a percentage of the total with the top, thickest stage being the largest, and each subsequent stage thinner than its predecessor. If you have a stage that appears thicker than the previous stage, this chart can help you identify a problem in your process.
There are two ways to use a funnel chart: You can either pick a category accompanied by a single value, or you can add multiple values. If you pick a category, the value will be broken by the members of the category, and each member is represented by a section within the funnel.
The fields appear in the same top-to-bottom order in the funnel as they appear in the panel. In addition, the value of the funnel’s top stage is always 100%, and the percentage value for each subsequent stage is derived from the top stage.

Information on configuring funnel charts is available in Configure a funnel chart.