Filter your data
By default, FH Analytics displays all the data in the FIREHOUSE Software database, with no filters applied. You can narrow the scope of the data displayed in FH Analytics by applying filters such as date ranges, categories of information (incidents, occupancies, inventory, etc.), city, fire department, unit, and so forth.
Note: You can make multiple selections in menus, graphs, the date area, and other areas by holding down the Ctrl key as you click. If you are using an iPad, you need to plug a keyboard into the device to use a Ctrl key.
-
At the top of the interface, click the tab for the type of data you want to work with.
Example: To analyze FIREHOUSE Software data related to incidents, click the Incidents tab.
The page for that data appears.
-
Under the row of tabs, click the sub-tab related to the specific type of information you want to look at for that type of data.
Note: Not all tabs have sub-tabs. Blank sub-tabs may appear on the major tabs, to accommodate future development of FH Analytics.
The content of the tab updates to display the type of data you selected.
-
Use the calendar section of the interface to specify a time frame in one of these ways.
Note: Depending on how the fiscal year start value is set on the Admin tab, the user interface for the calendar section may refer to a fiscal year or a calendar year. Information for parameters on the Admin tab is available in Specify administration options.
 Select entire weeks of the year
-
From Year or Fiscal Year, select the years for the data you want to examine.
If you do not select specific years, the data for all the years in the FIREHOUSE Software database is displayed.
-
Under CalendarWeek, select the number corresponding to the weeks of data you want to examine.
If you do not select specific weeks, the data for all the weeks in the years selected in the previous step is displayed.
 Specify a specific date range
-
From Year or Fiscal Year, select the years for the data you want to examine.
If you do not select specific years, the data for all the years in the FIREHOUSE Software database is displayed.
-
From CalendarMonth, select the months for the data you want to examine.
If you do not select specific months, the data for all the months in the years selected in the previous step is displayed.
-
From Day Num, select the days of the month for the data you want to examine.
If you do not select specific days, the data for all the days in the months selected in the previous step is displayed.
 Specify a date range
-
In the upper right corner of the tab, click Use Date Range.
The Date Range information pane appears below the Use Date Range button, and the button is renamed Use Date Selection.

-
For Start Date and End Date, click to the right of the equal sign, and then type the start and end dates you need in the format
MM/DD/YYYY.Example:
11/25/2006
-
-
Under Selections, for any item that has a white or green box in the right column, click the menu arrow next to an item you want to view data for, and then select options from the menu that appears.
Example: Click the menu next to City, and then select the cities you want to view from the menu that appears.
Tip: If the indicator in the right column is grey, there is no data available for that item and you can not use it as a filter.
If you select a single item from the menu, the item you selected is displayed in the Selections list and is highlighted green to indicate that it is an active selection. If you select multiple items from the menu, the selected indicator turns green to indicate that multiple selections were made from the menu. The other items under Selections may change to correspond to your selection.
The items you selected also appear under Current Selections.
-
(Optional) Under Selections, choose an option to do one of the following.
To do this Do this Exclude items that are currently selected (reverse the current selections)
Select all items in the list, including items that do not have data
- Click Select All.
Select all items with data in the list
- Click Select Possible.
Clear the current selections for the item you right-clicked
- Click Clear.
Clear selections for all items other than the one you right-clicked
- Click Clear Other Fields.
Clear all selections for all items
- Click Clear All Selections.
- Repeat the previous two steps for any item you want to filter data for in the graph.
-
(Optional) Under Current Selections, remove items from the filter list under Current Selections in one of these ways.
 Remove all filters from the list
Do one of the following.
- Above Current Selections, click Clear.
-
Right-click the information pane, and then choose Clear All Selections in the menu that appears.
Note: Clear All Selections is not available in all information panes.
Note: You can not change any of the selection details under Current Selections. Selection details must be set under Selections.
-
(If additional filters appear on the left side of the user interface) Click the filter, or enter a value to view the data with this filter applied in addition to the filters listed under Current Selections.
Additional filters appear on the left side of the user interface in the following locations.
- Compliance tab → Compliance sub-tab
- Compliance tab → Standard of Cover sub-tab
- Incidents tab → Maps sub-tab
- Staffing tab → Activities sub-tab
- Hydrants tab → Maps sub-tab
- Inventory tab
-
(If filters appear across the top of the information pane) Click the filter to view the data with this filter applied in addition to the filters listed under Current Selections.
Additional filters appear across the top of information panes in the following locations.
- EMS tab → Incidents sub-tab
- EMS tab → Assessments sub-tab
- Occupancies tab → Inspections sub-tab
-
(If data view selections appear in an information pane) On the right side of the information pane, click the data view you want to see in the graph.
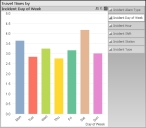
Depending on the data view you select, the data can appear as a graph or as data in a columnar format. The icon for each data view indicates how the data displays in the information pane.
Icon Displays the data as 
A bar graph. 
Raw data in a straight table. 
Raw data in a pivot table.

Raw data in a simple table. 
A pie graph. 
A comparison bar graph.

A line graph. -
(Optional) Add filters in the information pane in one of these ways.
 Bar graph view
-
Do one of the following.
- Click the bars (hold down the Ctrl key to click multiple bars) in the graph that you want to focus on.
-
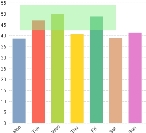
Click and drag the mouse over the bars in the graph that you want to focus on.
A green box appears behind the mouse pointer. Any bars touched by the box are selected.
The graph in the information pane updates to display only the bars you selected or clicked.
-
Return the bar graph to its default display.
-
(If more than one bar appears) Click any bar in the graph.
The graph is filtered further to display only the data for the single bar.
-
Click the single bar in the graph.
The graph displays all the bars again.
-
 Columnar format
-
Click a cell containing a data type that you would like to add as a filter.
The table of data in the information updates to display only the data type contained in the cell you clicked, and the additional filter appears under Selections and Current Selections.
Note: To remove the additional filter, you must edit the selections under Selections and Current Selections. You can not return the spreadsheet of data to its previous display by clicking a cell in the information pane.
Example: A bar graph contains a number of columns, making it hard to focus on the three data points you want to view. To filter the data down to only the three bars you want to view, you hold down the Ctrl key on your keyboard as you click the three bars. The graph refreshes to display only those bars.
Example: Under Selections, you have filtered the data to display all the incident counts in Baton Rouge that have an incident type description of 100, 111, or 112, and you are looking at the Incident Authorizations data view. The resulting spreadsheet of information in the information pane is longer than you expected.
To filter the data further, so that you are only viewing the incidents with a type description of 112, in the Type column, you click a cell containing
112 Fires in structure other. The type description filter112 Fires in structureis applied to the data, and only the data containing incident counts in Baton Rouge that have an incident type description of112 Fires in structureappears. -


