Navigate in FH Analytics
-
Click the tab for the type of data you want to work with.
Example: To analyze FIREHOUSE Software data related to incidents, click the Incidents tab.
The page for that data appears.
-
Click the sub-tab related to the specific type of information you want to look at.
The content of the tab updates to display the type of data you selected.
-
In the calendar section of interface, click the years, months, days, or calendar week to focus on data in the time frame you want to work with.
Example: To look at the first-quarter data in 2009, under Year, select
2009, under CalendarMonth, select Jan, Feb, and Mar, and under Day Num, select all the days of the month.Tip: To select multiple years, months, days, or weeks in the calendar section, hold down the Ctrl key on your keyboard as you click.
As you make selections, the different areas of the interface turn gray and a progress wheel appears in each area as FH Analytics filters the data to match your selections.
-
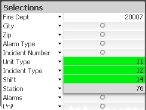
In the filter list under Selections, make selections that filter the data to only the information you want to view.
-
On the left side of the list, click the menu arrow next to an item you want to view data for, and then select the options from the menu that appears.
Example: Click the menu next to Alarm Type, and then select the types of alarms you want to view from the menu that appears.
Tip: To select multiple items in the menu, hold down the Ctrl key on your keyboard as you click.
The selected indicator in the Selections list (green square) for that filter, and the selections you make in the menu appear in the filter list under Selections. The items listed under Selections may change, depending on the options you select from the drop-down menu.
Note: You can not change the details of selections under Current Selections. You can, however, clear the entire list of filters under Current Selections by clicking Clear.
- Repeat the previous step for any item you want to filter data for in the graph.
- (Optional) Click the green selected indicator (toggle it to white) to exclude a data item from the list under Current Selections.
-
-
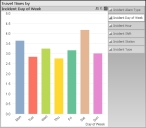
In the upper right corner of the graph, click the different data views to see the corresponding graph of the filtered data.
Note: The names of the data views vary, depending on the tab and sub-tab you selected in steps 1 and 2.
-
(If the Fast Change
 icon appears in the upper right corner of an information pane) Click the Fast Change
  icon to toggle the data display between a bar graph, line graph, and columnar data.
 -
(Optional) Print the graph.
-
Click the Print
 icon.
icon.The Print dialog box appears.
- Use the dialog box to specify the parameters you want for printing the graph.
-
-
(Optional) Click the Send to Excel
 icon.
icon.Microsoft Excel launches, and the data from the graph appears in a spreadsheet.


